Code Quality Reporting and Trending
QuickBuild supports a lot of tools for improving your code quality, including code inspection and coverage tools. With the features supplied by QuickBuild, the development team can improve the code quality continually over time.
Inspection/Coverage results in build overview page
The inspection/coverage results will be summarized in build overview page. Below is a findbugs example:
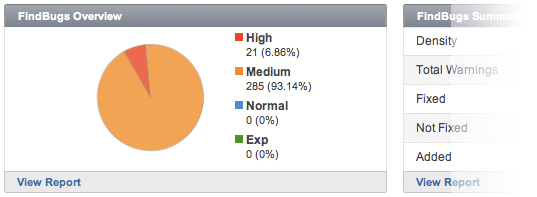
FindBugs Overview
In build overview tab, the findbugs summary will display:
- The number and percentage of high/medium/normal/Exp. warnings.
- The average density of the code.
- The total warnings.
- The number of fixed, not fixed and new warnings.
Analyze the results
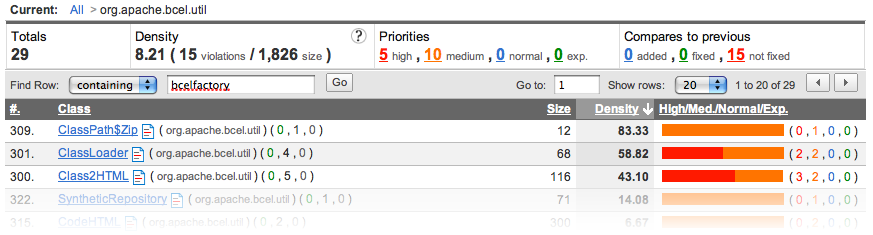
The inspection/coverage results are displayed as below, you may re-order, filter the results to get what you want easily. Most of time, you may just need to click some links and QuickBuild will combine the filters automatically.
Source code review
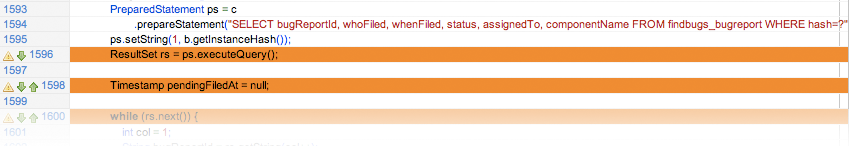
By clicking icon  , you can open the source file to inspect the code. This feature is very useful when do code review.
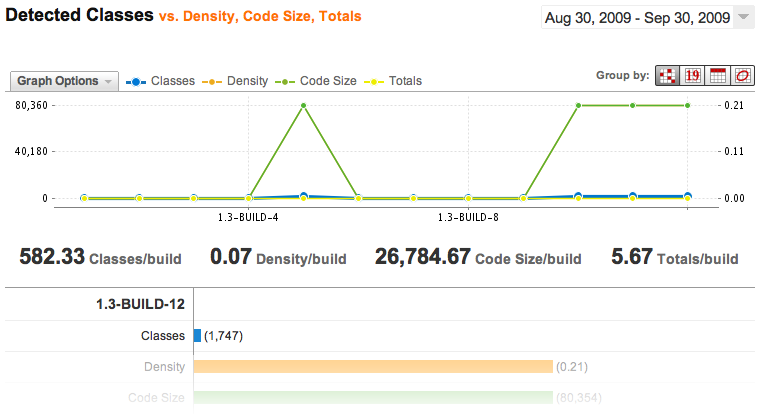
Statistics chart
By analyze the statistics chart, you may easily find the quality trends of your source code over time. You can compare different metrics, with different configurations, in different date ranges. You can also group metrics by version, by day, by week, or by month.
Code quality trends reports
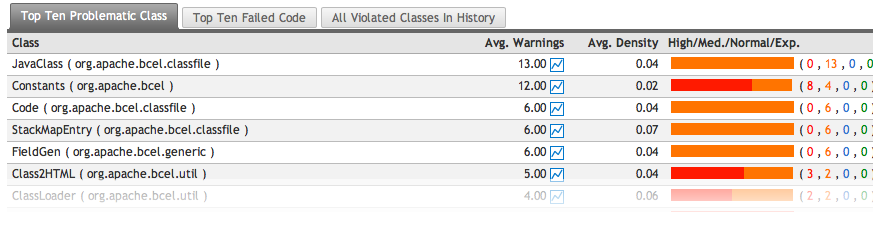
QuickBuild analyze the statistics data, and will generate the trend reports. These reports can help to know which files/classes are causing most of the problems, which kind of rule are violated most frequently (findbugs report only), and also the average violations/coverage-rate of each file/class.